The Professional Dashboard | How to Measure Client Success
The Versus Professional Dashboard was designed to enable professionals to track the progress of their clients using the Versus system. These are suggestions for ways you may choose to determine if your clients are progressing with Versus.
Success and progress may mean something different for each client. Ultimately, you should determine if a client is making progress by using your own expertise and considering the client’s self-reports and personal goals.
1. Compare Session Score and Goal
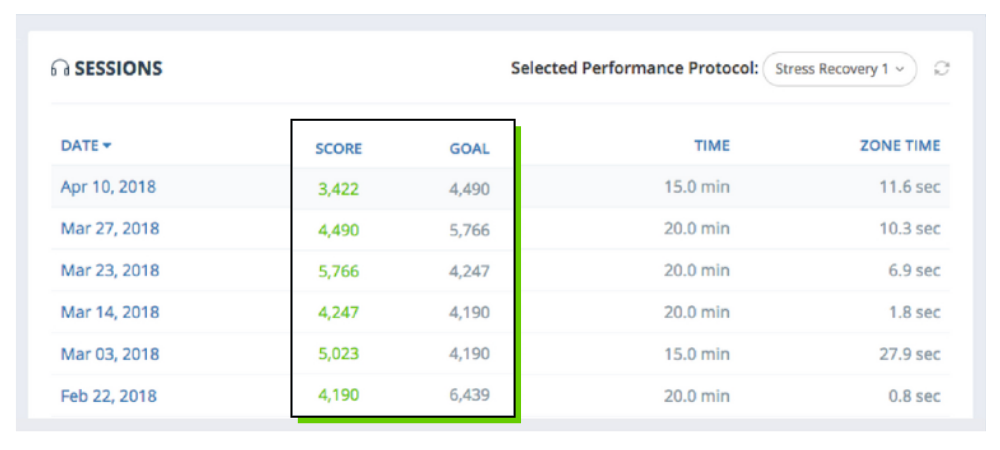
One way to assess a client’s progress is to look at their session score for each exercise session.
From your Dashboard Homepage, or from the Team Page for the client’s team, select the client’s first name, which will be a blue hyperlink. This will take you to the client’s User Page.
You should automatically be able to view the client’s session data. If you cannot see this data, select the “Sessions” tab from the Navigation Pane of the User Page.
If the user’s score meets or surpasses their goal for an exercise session, that is one indication of success. If the user is failing to meet their points goal, consider the level and difficulty for that session, as explained here.
2. Analyze Between-Session Trends
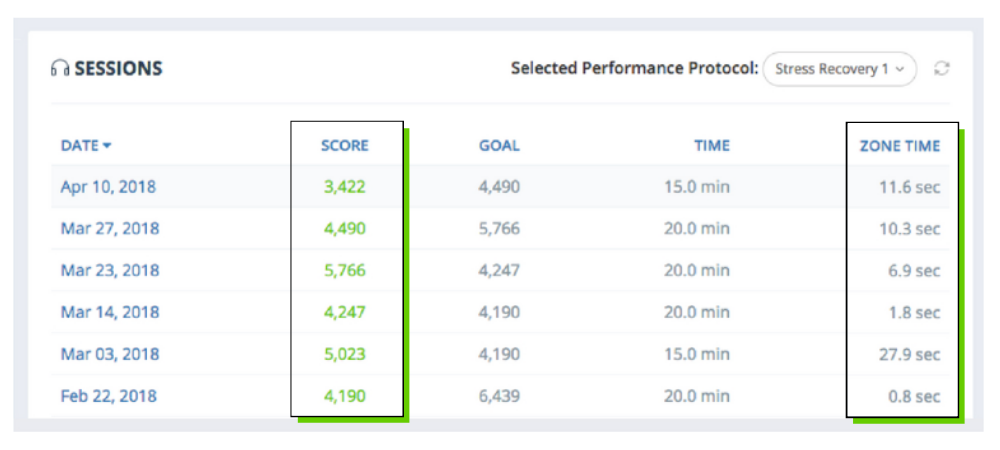
Another way to determine if a client is making progress with Versus is to view their between-session trends in score and zone time.
To view a client’s session data, select their first name from your Dashboard Homepage or from the Team Page for the client’s team. This will take you to the client’s User Page.
You should automatically be able to view the client’s session data. If not, select the “Sessions” tab from the Navigation Pane of the User Page.
The user’s score and zone time should generally increase in each subsequent session on a specific performance protocol. If a user is accumulating fewer points or less zone time in their recent session(s) than in their previous session(s), examine the level and difficulty for those sessions.
3. View Level and Difficulty
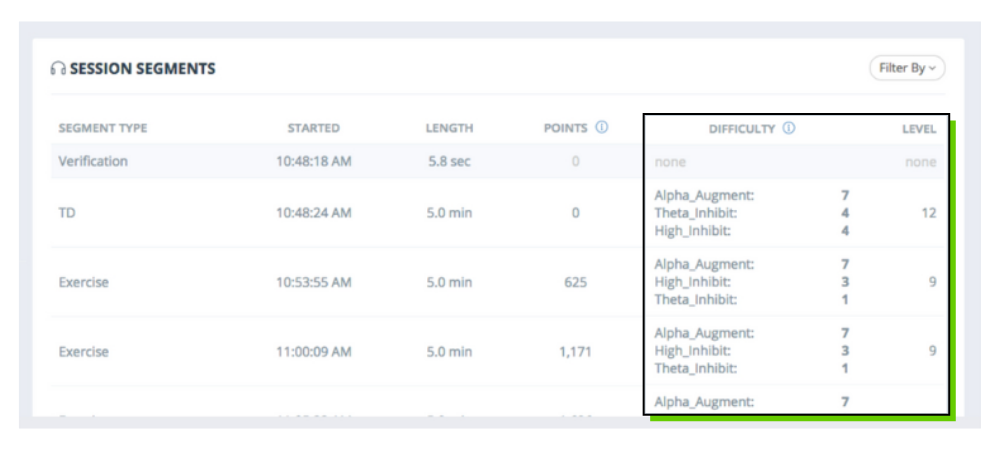
If a user accumulated fewer points than expected during a session, looking at the level and difficulty for that session can help you better understand the client’s progress.
To view the details of a particular exercise session, click on the session date from the client’s User Page. The date will be a blue hyperlink.
Compare the level and difficulty for that session with those in the previous session(s). Users may not have been able to reach their points goal because they were moved to a higher level and/or difficulty for that session than in their previous session(s). If users were still able to accumulate points at an increased level and/or difficulty, this is an indication of success in creating the desired brain state.
4. Examine Between-Assessment Trends
To assess a client’s longer-term progress on a performance protocol, look at their between-assessment trends.
The goal of the exercises is to achieve a balanced profile. Construct scores in the “low” (1-3) range are considered weaknesses. Scores in the “high” range are not necessarily ideal. The aim is not to be in the “high” range for every construct, but rather to be in the “good” (4-7) range for most constructs.
To access a client’s Assessments Page, select the “Assessments” tab from the Navigation Pane on the client’s User Page.
Select the different tabs on the Assessment Trends graph to view graphs of the user’s construct scores, response time, and errors.
In general, you should look for the user’s lowest construct scores to move closer to the “good” range (4-7). Additionally, the user’s response time, variability, and number of errors are expected to decrease across assessments, especially for users on focus performance protocols.
Terms and Definitions
Construct Scores:
The 6 measures calculated during the NeuroPerformance Assessment (NPA). The user is assigned a performance protocol based on these constructs.
Difficulty:
A level (1-10) for each frequency band that is a measure of how difficult it is to get the circle associated with that band to converge in the middle. Users do not see this level in the app, as it automatically moves up or down based in how well the user is performing during their session.
Errors:
Commission Errors: Tapping the screen on non-targets during the Continuous Performance Task (CPT) portion of the NeuroPerformance Assessment (NPA). This type of error reflects a more impulsive style.
Omission Errors: Failure to tap the screen for targets during the Continuous Performance Task (CPT) portion of the NeuroPerformance Assessment (NPA). This type of error reflects a more inattentive style.
Level:
Refers to the game level the user achieved during their session. This level is visible to the user in the app.
Response Time:
An indication of how quickly the user was able to recognize and tap targets during the Continuous Performance Task (CPT) portion of the NeuroPerformance Assessment (NPA).
Session Goal:
The points goal that is automatically assigned to the user for each exercise session. This goal is based on how many points the user accumulated in their previous exercise session.
Session Score:
Refers to how many points the user accumulated during their exercise session.
Variability:
An indication of how much the user’s response time varied during the Continuous Performance Task (CPT) portion of the NeuroPerformance Assessment (NPA).
Zone Time:
The amount of time that the user was in the optimal zone during that session.


